Finding a market that is moving decisively can be just as challenging as deciding when to enter a trade. Traders who monitor several currency pairs, gold and indices may spend considerable time switching between charts, only to discover that many instruments are moving sideways rather than offering clear directional conditions.
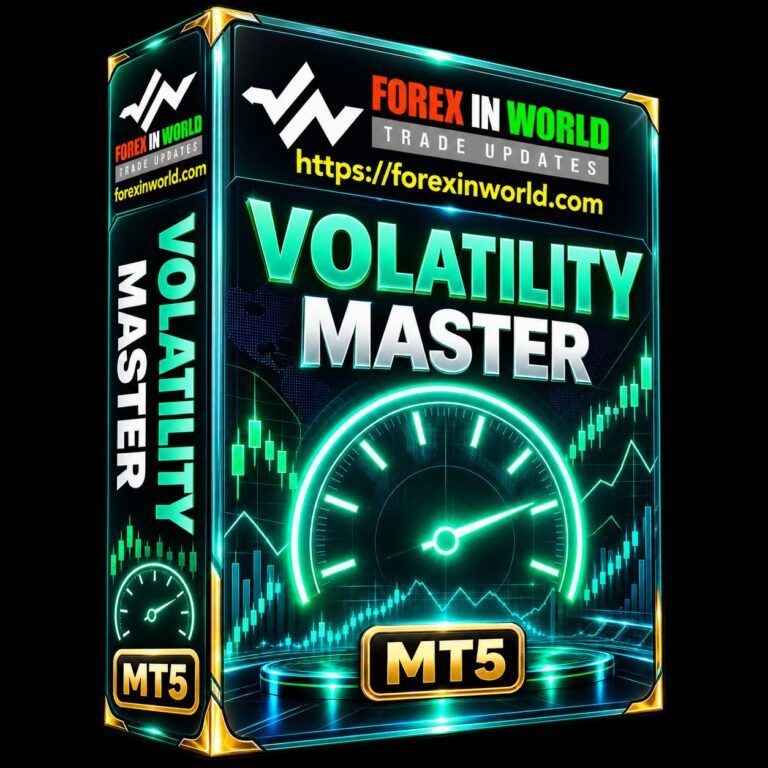
Volatility Master MT5 addresses this workflow problem with a dashboard that scans multiple instruments and combines volatility readings with directional market information. Developed by Intraquotes, the indicator is designed to help traders identify markets displaying stronger activity while distinguishing them from quieter, range-bound conditions. Its value lies in organising market information; it does not establish that a signal will lead to a profitable trade.
What Is Volatility Master MT5?
Volatility Master MT5 is a custom indicator for MetaTrader 5 available through the official MQL5 Market listing. It presents information from multiple symbols in a single dashboard, allowing traders to compare market conditions without opening every chart individually.
Get This Trading BOT on Telegram
Want to Download this Trading BOT? Connect with Forex In World directly on Telegram to enquire about this product, get more details, and Download link.
Ready to Get Started? Contact us on Telegram now!
CONTACT US ON TELEGRAM




TOP 28
FOREX BROKERS
Choose your broker, sign up through an eligible cashback link, trade as usual, and receive rebates according to the offer terms.
80%
Choose from these 28 brokers
 XM
 Elev8
 Exness
 JustMarkets
 HFM
 TMGM
 Valetax
 Headway
 Markets4you
 RoboForex
 Vantage Markets
 IC (IC Markets)
 FxPro
 Tickmill
 FP Markets
 Weltrade
 Axi
 Ultima Markets
 TitanFX
 Harmovest Capital
 FP Trading
 VT Markets
 MTrading
 FXTM
 FIBO Group
 Windsor Brokers
 GO Markets
 FXPrimus
How to get cashback
Select one of the brokers above and check its available cashback offer.
Open an account using the eligible cashback or partner link.
Trade in an eligible account and follow the offer's rules.
Get eligible rebates based on the program's payout method and schedule.
*“Up to 80%” is a maximum promotional claim, not a guaranteed cashback rate. Actual rebates, supported countries, account types, trade eligibility and payout terms vary. Broker cards use the ForexInWorld cashback link; check the offer terms and account eligibility before signing up. Forex/CFD trading involves substantial risk.
The developer describes it as a volatility scanner with bullish, bearish and ranging states. Rather than showing volatility as a number alone, the dashboard combines activity levels with directional context. This can help a trader decide which instruments deserve closer inspection before considering a setup.
The indicator is designed for discretionary analysis. Its signals are intended to support trading decisions, not to replace a trader’s entry rules, position sizing or risk controls. The marketplace description also states that the product does not provide data-window values or indicator buffers for Expert Advisor integration, so it should not be assumed to be a direct component for automated trading systems.
Main Features and Trading Applications
Multi-symbol market scanning
Volatility Master can scan up to 50 symbols, with the exact selection determined by its settings and available market data. The dashboard sorts instruments by volatility, helping traders identify which markets are currently showing relatively greater activity.
This can be useful when several instruments are available but time is limited. A trader might scan the list, select a market that fits their strategy, and then open its chart for a more detailed assessment.
Volatility and directional states
The indicator presents market conditions using three broad states: high volatility, moderate volatility and ranging conditions. It also displays directional information, including bullish and bearish trend states.
These distinctions matter because volatility and direction describe different aspects of the market. High volatility means price is moving more actively; it does not automatically mean that the movement is directional or suitable for a particular trading strategy. A fast-moving market can reverse sharply, while a quieter market may still offer opportunities for strategies designed for ranges.
Multi-timeframe analysis
The dashboard supports M15, H1, H4 and D1 analysis. Traders can use these views to compare short-term activity with conditions over longer periods.
For example, an intraday trader may inspect a lower timeframe for current activity and then check a higher timeframe to understand the broader direction. Agreement between timeframes can add context, although it cannot guarantee continuation.
Alerts and chart navigation
The indicator includes configurable popup and mobile push alerts. Its settings allow traders to control the volatility threshold, the number of symbols scanned and which of the most volatile instruments trigger notifications. The dashboard also provides quick navigation to a selected instrument’s chart.
The developer recommends using a separate chart for the dashboard rather than attaching it to the same chart used for executing trades. Consult the official instructions before changing the settings, particularly if the dashboard does not display all expected symbols.
“High volatility is an observation, not an instruction to trade. The most useful scan is one that narrows the market to a manageable shortlist, leaving the trader to determine whether the movement fits a tested setup and an acceptable level of risk.”
Volatility Master MT5: Product Details
The following information is taken from the product’s published MQL5 Market page. Prices and software details may change, so verify the listing before purchase.
| Item | Published information |
|---|---|
| Product | Volatility Master MT5 |
| Developer | Intraquotes |
| Platform | MetaTrader 5 |
| Publication date | 16 January 2024 |
| Listed version | 1.14 |
| Last listed update | 15 October 2026 |
| Displayed price | US$199 |
| Activations | 5 |
| Official product page | MQL5 Market |
The developer also provides product documentation through the marketplace listing. Review the current terms, installation guidance and compatibility notes before purchasing or installing the software.
Installation and Configuration
The official listing explains that installation is handled through the MetaTrader terminal’s Market section. After installation, attach the indicator to a fresh chart and allow it to load the required market data.
Users can choose which symbols to scan, set the maximum number of instruments, select a dashboard size and position, and configure the alert threshold. The indicator supports standard MetaTrader platforms; the developer does not support modified third-party environments or offline and artificially generated chart symbols.
Historical data and symbol availability can affect what appears on the dashboard. If a market is missing, check that the instrument is available through the broker and that the terminal has loaded the relevant chart history. The official MetaTrader 5 help centre provides general guidance on using the platform and its tools.
Testing Volatility Signals Responsibly
Before using the indicator in a live account, observe its readings on a demo account across different market conditions. Include quiet sessions, strong trends and periods of sudden volatility. This helps establish whether its classifications suit the way you intend to trade.
Keep a record of the market state when an alert appears and what price does afterward. If you evaluate a strategy built around the dashboard, define entry and exit conditions before analysing results. Include spreads, commissions and slippage where relevant, since these costs can materially change the outcome of short-term trading.
The developer’s marketing description uses language about identifying high-probability opportunities, but the product listing does not establish that every signal has a particular win rate or guarantees an edge. Independent testing is needed before drawing conclusions about performance.
Frequently Asked Questions
1. Why might a high-volatility instrument still be unsuitable for a breakout strategy?
Volatility can increase during both directional moves and abrupt reversals. A breakout strategy needs additional criteria to assess whether price has moved beyond a meaningful level and whether the move has sufficient follow-through.
2. Can the dashboard identify the best time of day to trade?
The dashboard reports market conditions using its configured instruments and timeframes. It should not be treated as proof that a particular session is consistently more profitable. Traders need separate analysis to evaluate session-specific behaviour for their chosen instruments.
3. How should traders compare volatility readings across different asset classes?
Different markets have different price scales, trading hours and typical movement patterns. Use the indicator’s documented calculations and thresholds rather than assuming that a given reading has identical significance for a currency pair, gold, a cryptocurrency and an index.
4. What can cause alerts to become too frequent?
A low volatility threshold or a broad symbol selection can generate more notifications. Traders can adjust the documented alert filters and frequency settings to reduce noise, but should avoid restricting alerts so aggressively that meaningful conditions are routinely missed.
5. Does a visual backtest prove that the dashboard will work the same way live?
No. A visual test can help inspect historical readings, but it may not fully represent live data availability, execution costs or changing market conditions. Forward observation is useful for checking how the tool behaves as new information arrives.
To find the available download instructions, unlock the social locker below this article. If you need assistance with the process, contact Telegram support at https://t.me/FxCare.
For Instant Indicator Access pay by following payment options. Pay $25 only.
-
Pay in Your Local Currency
-
Pay with Cryptocurrency
Pay with a payment method available in your country. Click below buttons to see your available options.
After payment done, please send your Payment transaction number/ reference ID/ or screenshot of your Payment transaction details to one of the contact details given below.
Contact us at the details given below:
⦿ Email Address: forexinworld@gmail.com
⦿ Telegram Address: https://telegram.me/FxCare
⦿ Payable Amount: $25 (USD)
Option 1

==========
Option 2

Pay and Download this INDICATOR.
We accept 300+ cryptocurrencies. Pay $25 through any cryptocurrency using the following payment gateway. If you do not find any Indicator in forexinworld.com, then contact us directly. Contact details are given below.
Contact us at the details given below:
⦿ Email Address: forexinworld@gmail.com
⦿ Telegram Address: https://telegram.me/FxCare