Sudden price expansions can create trading opportunities, but identifying a developing move before it becomes obvious is difficult. The Precision Spike Detector is a MetaTrader 5 indicator marketed as a tool for analysing potential high-momentum movements, particularly in synthetic indices. Traders considering it should understand the developer’s claims, the intended markets and the limitations of signal-based trading before downloading or purchasing the software.
The product is listed on the official MQL5 Market under the name Precision Spike Detector. Its published description presents a multi-layer analytical system that combines volatility, momentum and trend-related measurements. However, promotional descriptions are not independent evidence of accuracy, and the presence of a signal should not be treated as confirmation that a spike will occur.
What Is Precision Spike Detector MT5?
Precision Spike Detector is a technical indicator for MetaTrader 5, developed by Francisco Mandomo Simbine, also known as Xavic Mforex, according to its MQL5 listing. The product is presented as a chart-analysis tool for synthetic markets, including Boom, Crash, GainX and PainX indices.
Get This Trading BOT on Telegram
Want to Download this Trading BOT? Connect with Forex In World directly on Telegram to enquire about this product, get more details, and Download link.
Ready to Get Started? Contact us on Telegram now!
CONTACT US ON TELEGRAM




TOP 28
FOREX BROKERS
Choose your broker, sign up through an eligible cashback link, trade as usual, and receive rebates according to the offer terms.
80%
Choose from these 28 brokers
 XM
 Elev8
 Exness
 JustMarkets
 HFM
 TMGM
 Valetax
 Headway
 Markets4you
 RoboForex
 Vantage Markets
 IC (IC Markets)
 FxPro
 Tickmill
 FP Markets
 Weltrade
 Axi
 Ultima Markets
 TitanFX
 Harmovest Capital
 FP Trading
 VT Markets
 MTrading
 FXTM
 FIBO Group
 Windsor Brokers
 GO Markets
 FXPrimus
How to get cashback
Select one of the brokers above and check its available cashback offer.
Open an account using the eligible cashback or partner link.
Trade in an eligible account and follow the offer's rules.
Get eligible rebates based on the program's payout method and schedule.
*“Up to 80%” is a maximum promotional claim, not a guaranteed cashback rate. Actual rebates, supported countries, account types, trade eligibility and payout terms vary. Broker cards use the ForexInWorld cashback link; check the offer terms and account eligibility before signing up. Forex/CFD trading involves substantial risk.
The listing describes an analytical framework combining indicators such as Average True Range (ATR), Bollinger Bands, Relative Strength Index (RSI), Stochastic and Average Directional Index (ADX). These are established technical-analysis tools used to examine different aspects of price behaviour. Their combination may help structure an analysis, but it does not establish that the resulting signals have a particular success rate.
The developer also describes signal classifications and a visual dashboard intended to help users interpret market conditions. Traders should consult the current listing for the precise functions included in the version they intend to use.
How the Detection Method Is Described
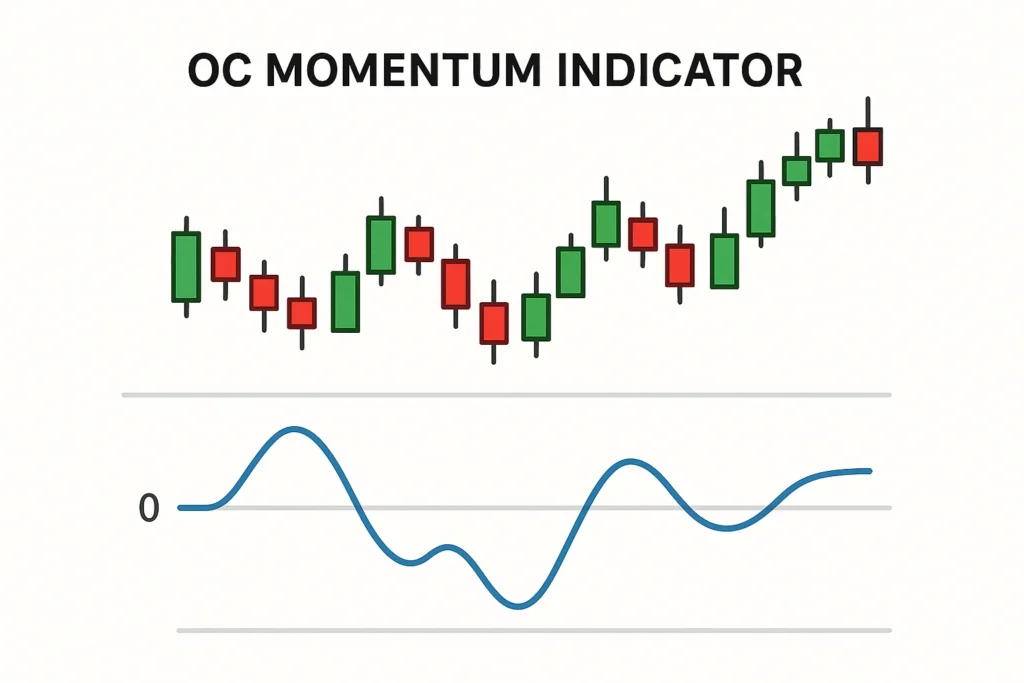
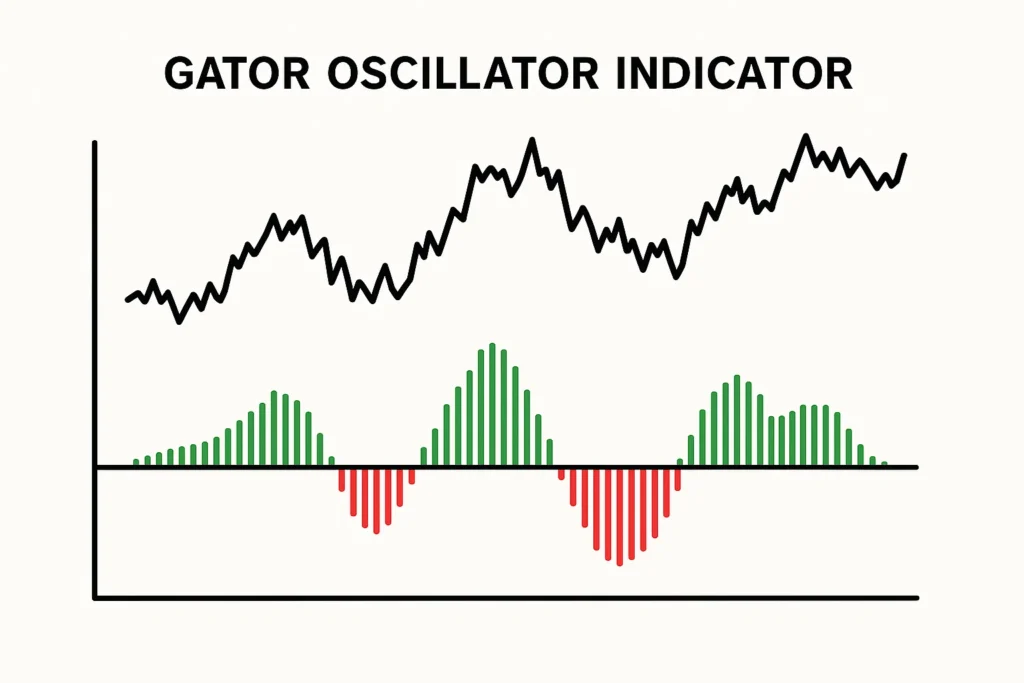
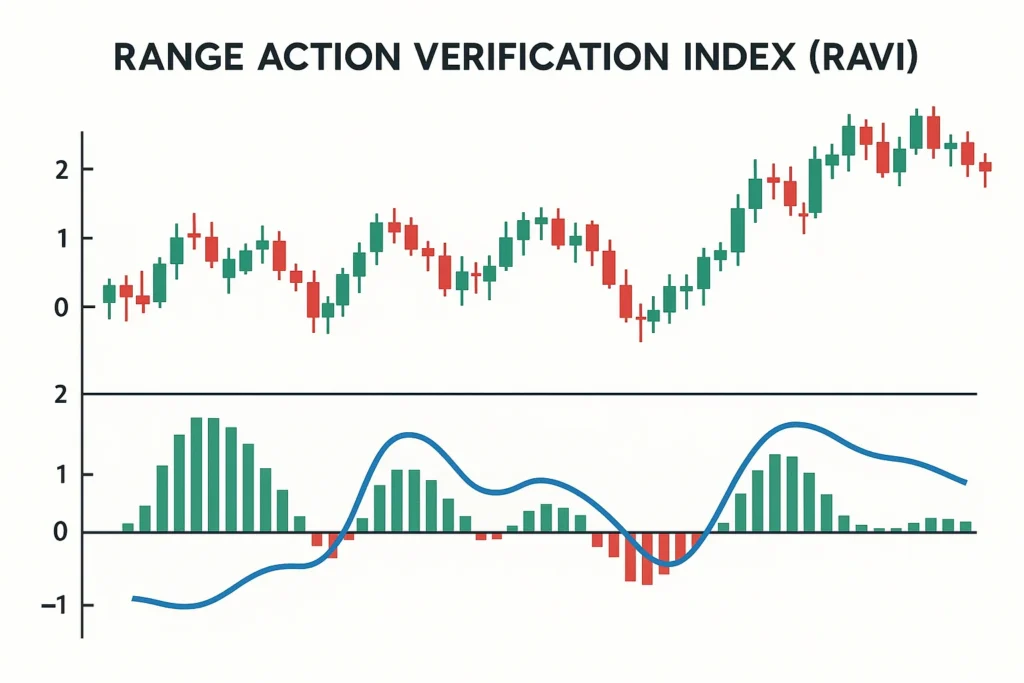
The product’s stated approach combines several types of market information rather than relying on a single measurement. Volatility tools can help identify changes in the size of price movements, while momentum indicators assess the strength or direction of recent price action. Trend-strength measurements provide another perspective on whether a move has directional persistence.
The developer describes these inputs as part of a multi-layer decision process. That is a description of the product’s advertised methodology, not proof that the indicator can predict an impending spike. A market can display rising volatility or strong momentum and still reverse, consolidate or move in an unexpected direction.
The listing also refers to multi-timeframe analysis. Before relying on this feature, traders should check the product’s current documentation and settings to understand how signals from different timeframes are combined and whether a signal can change before a candle closes.
Product Details and Download Availability
The official listing is the primary source for the current version, purchase terms, supported functions and any available demo. At the time of research, the listing identified version 3.0, updated on 6 April 2026, with a displayed price of US$155. Prices and availability may change, so confirm the live details before purchasing.
The product page describes M1 as the technical specification timeframe while also discussing multi-timeframe analysis from M5 to D1. Because these references serve different purposes, users should verify the intended chart timeframe and configuration in the current instructions rather than assuming every timeframe is supported in the same way.
Visit the Precision Spike Detector product page on MQL5 to review the developer’s description, current terms and any available testing options. Do not assume that a third-party download is authorised or that a paid product is available free of charge.
A Practical Framework for Evaluating Spike Signals
A useful evaluation should measure more than whether a signal appears shortly before a large candle. It should assess how the indicator behaves across different conditions and whether the results remain meaningful after trading costs.
Suggested evaluation plan
| Evaluation stage | What to record |
|---|---|
| Signal timing | Whether the marker appeared before, during or after the price expansion |
| Market regime | Whether conditions were trending, ranging or unusually volatile |
| Adverse movement | The maximum movement against the hypothetical position before exit |
| Signal stability | Whether historical markers changed after subsequent candles appeared |
| Sample coverage | Whether observations span different market periods rather than one favourable session |
These are general testing criteria, not confirmed features of Precision Spike Detector. They can help traders independently assess an indicator without relying solely on screenshots or selected examples.
“An early warning is valuable only when its limitations are understood. A signal that appears ahead of a dramatic move may look compelling in isolation, but consistent evaluation must also account for missed moves, false alarms and adverse price movement.”
Installation and Platform Considerations
MetaTrader 5 indicators are generally installed through the platform’s supported Market workflow or through the appropriate indicator files supplied by their developer. The exact process depends on how the product is distributed.
For a product obtained through MQL5, follow the instructions provided on the listing and within the platform. The official MetaTrader 5 Market documentation explains how users browse and manage trading applications. Check that the indicator appears in the correct platform and that its instructions match your installed version.
If notifications are part of your intended workflow, verify the relevant permissions and platform configuration before relying on alerts. Test the setup under observation rather than assuming a notification will always arrive instantly.
Limitations Traders Should Consider
Synthetic indices differ from conventional currency pairs because their price behaviour is generated according to the provider’s market model rather than being directly driven by the usual exchange-rate relationships. Strategies developed for major forex pairs therefore should not automatically be transferred to synthetic markets.
Even when a signal appears technically convincing, execution costs, slippage and the speed of price changes can affect the outcome. Leverage can magnify losses as well as gains. No indicator removes the need for a defined trading plan, appropriate position sizing and a clear limit on acceptable losses.
Frequently Asked Questions
1. How can traders detect whether a signal has repainting behaviour?
Record signals in real time and compare them with the same chart after additional candles have formed. Save timestamps or screenshots so that later changes can be identified. Historical chart inspection alone may not reveal whether earlier markers were altered.
2. What is the difference between signal accuracy and trading expectancy?
Signal accuracy measures how often a defined prediction meets a chosen success criterion. Trading expectancy also considers the average size of wins and losses. A system with frequent successful signals can still lose money if its unsuccessful trades are substantially larger.
3. Why should a test include quiet and volatile market periods?
An indicator may respond differently when price movement is limited than when volatility expands sharply. Testing a broader range of conditions helps reveal whether the method depends on a narrow market environment and reduces the risk of drawing conclusions from an unrepresentative sample.
4. How should traders handle conflicting signals across timeframes?
Define the decision hierarchy before testing—for example, whether a higher-timeframe condition acts as a filter or whether a lower-timeframe signal can stand alone. Then apply the same rule to every eligible setup instead of changing the interpretation after seeing the outcome.
5. Can results from one synthetic-index provider be transferred to another?
Not without separate validation. Different instruments may use different price-generation rules and exhibit different volatility patterns. Test the indicator on the exact instrument and data feed intended for use, and avoid assuming that similar names imply equivalent behaviour.
For download instructions, unlock the social locker below this article to view the available steps. If you encounter difficulties, you can contact Telegram support at https://t.me/FxCare. Check the official MQL5 listing for current product availability and licensing terms.
⬇️⬇️⬇️⬇️⬇️
For Instant Indicator Access pay by following payment options. Pay $25 only.
-
Pay in Your Local Currency
-
Pay with Cryptocurrency
Pay with a payment method available in your country. Click below buttons to see your available options.
After payment done, please send your Payment transaction number/ reference ID/ or screenshot of your Payment transaction details to one of the contact details given below.
Contact us at the details given below:
⦿ Email Address: forexinworld@gmail.com
⦿ Telegram Address: https://telegram.me/FxCare
⦿ Payable Amount: $25 (USD)
Option 1

==========
Option 2

Pay and Download this INDICATOR.
We accept 300+ cryptocurrencies. Pay $25 through any cryptocurrency using the following payment gateway. If you do not find any Indicator in forexinworld.com, then contact us directly. Contact details are given below.
Contact us at the details given below:
⦿ Email Address: forexinworld@gmail.com
⦿ Telegram Address: https://telegram.me/FxCare